Can we Blame Humans?
Considering I’ll be working in the field of “extremes attribution” for at least the next few years, I thought it may be worth my while communicating some of what I do on a public platform. I’ll attempt to communicate science using non-academic jargon and by keeping my posts entertaining (by using images and analogies for example)! Don’t hesitate to comment, critique, or if there’s anything you’re not getting - ask a question in the box way below.
So what does “extremes attribution” actually mean? Suppose a heatwave or flooding event has recently occurred. The extremes attribution community is often faced with answering the question: “are humans to blame for causing this weather event?” or worded differently: “did the greenhouse-gases emitted from the combustion of fossil fuels since the Industrial Revolution cause this weather event?” It is in fact impossible to answer this question since the event could have (in most cases) still occurred had we never changed the chemistry of the atmosphere. Let me explain with an analogy.
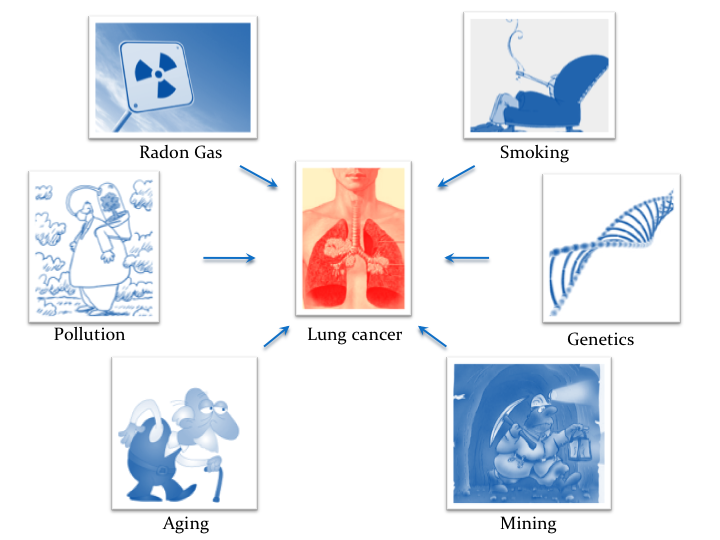
If a smoker is diagnosed with lung cancer, we cannot immediately blame the act of smoking on causing the disease: smoking may be thought to be a credible cause - but a cigarette manufacturer would be the first to point out that there are numerous other causes of lung cancer. Because there is more than one cause, we cannot say smoking “did” or “didn’t” cause your cancer: we can only describe the relevant contributions from all causes in terms of probability. An event attribution study was performed to find out the degree by which smoking increases your chances of contracting cancer: it distinguished the influence of one cause from all other possible causes. Thanks to the study, we now know that smoking is responsible for 80-90% of all lung cancer cases. It quantitatively clarified what was previously prone to speculation. With studies attributing the risk of lung cancer to the act of smoking, governments could implement policy and public awareness campaigns based on these attribution statements.
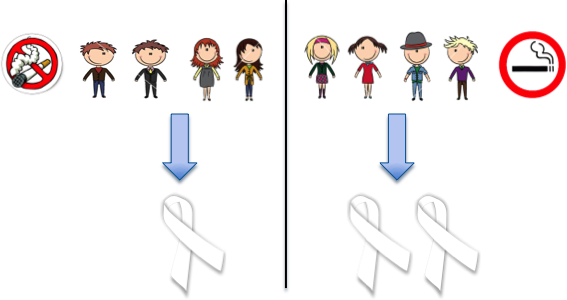
How could such a study be performed? First, random groups of non-smokers and smokers (without cancer) would have to volunteer themselves (see schematic below). Assume that the percentage of people in each scenario who emerge as cancer patients is found to be 25% from the non-smokers and 50% from the smokers. The study here suggests that the habit of smoking is responsible for two-thirds of lung cancer cases. The ‘probability ratio’, is a number characterising the change in probability and is given here by the probability of contracting lung cancer as a smoker (with the ‘external influence’: cigarettes), divided by the probability of contracting lung cancer as a non-smoker (without the ‘external influence’). According to this example, the risk of contracting lung cancer if one smokes, doubles (probability ratio = 50%⁄25% = 2). The number of people in each group was kept low for explanatory purposes - the statistics can be resolved accurately when the sample size is large.
The analogy provided above is a fitting one in terms of my work. The resemblances are highlighted in the following table:
| In my analogy | In my work | |
|---|---|---|
| The 'altered' scenario: | the smokers | model simulations representing a world with human activity |
| The 'natural' scenario: | the non-smokers | model simulations representing a world without human activity |
| The 'event' we are interested in: | lung cancer | an extreme weather event |
We can think of what is happening on Earth as an experiment which began roughly 200 years ago at the start of the Industrial Revolution. The current state of the atmosphere has deviated from its natural state just as the state of a smoker’s vital organs is altered from a natural state after being introduced to smoking. If the schematic above were to be remade within the climate context, it would look as follows:

This figure illustrates a popular method carried out by current event attribution in order to approximate human contribution to the chance of weather extremes. The question marks symbolise a primary objective: to establish the probability of occurrence of various weather extremes in both a world with and without anthropogenic emissions. Like in the smoking analogy, a ‘probability ratio’ can subsequently be calculated.
Welcome to my site! I hope you find something interesting here.