Animations of 2010-2014 Weather
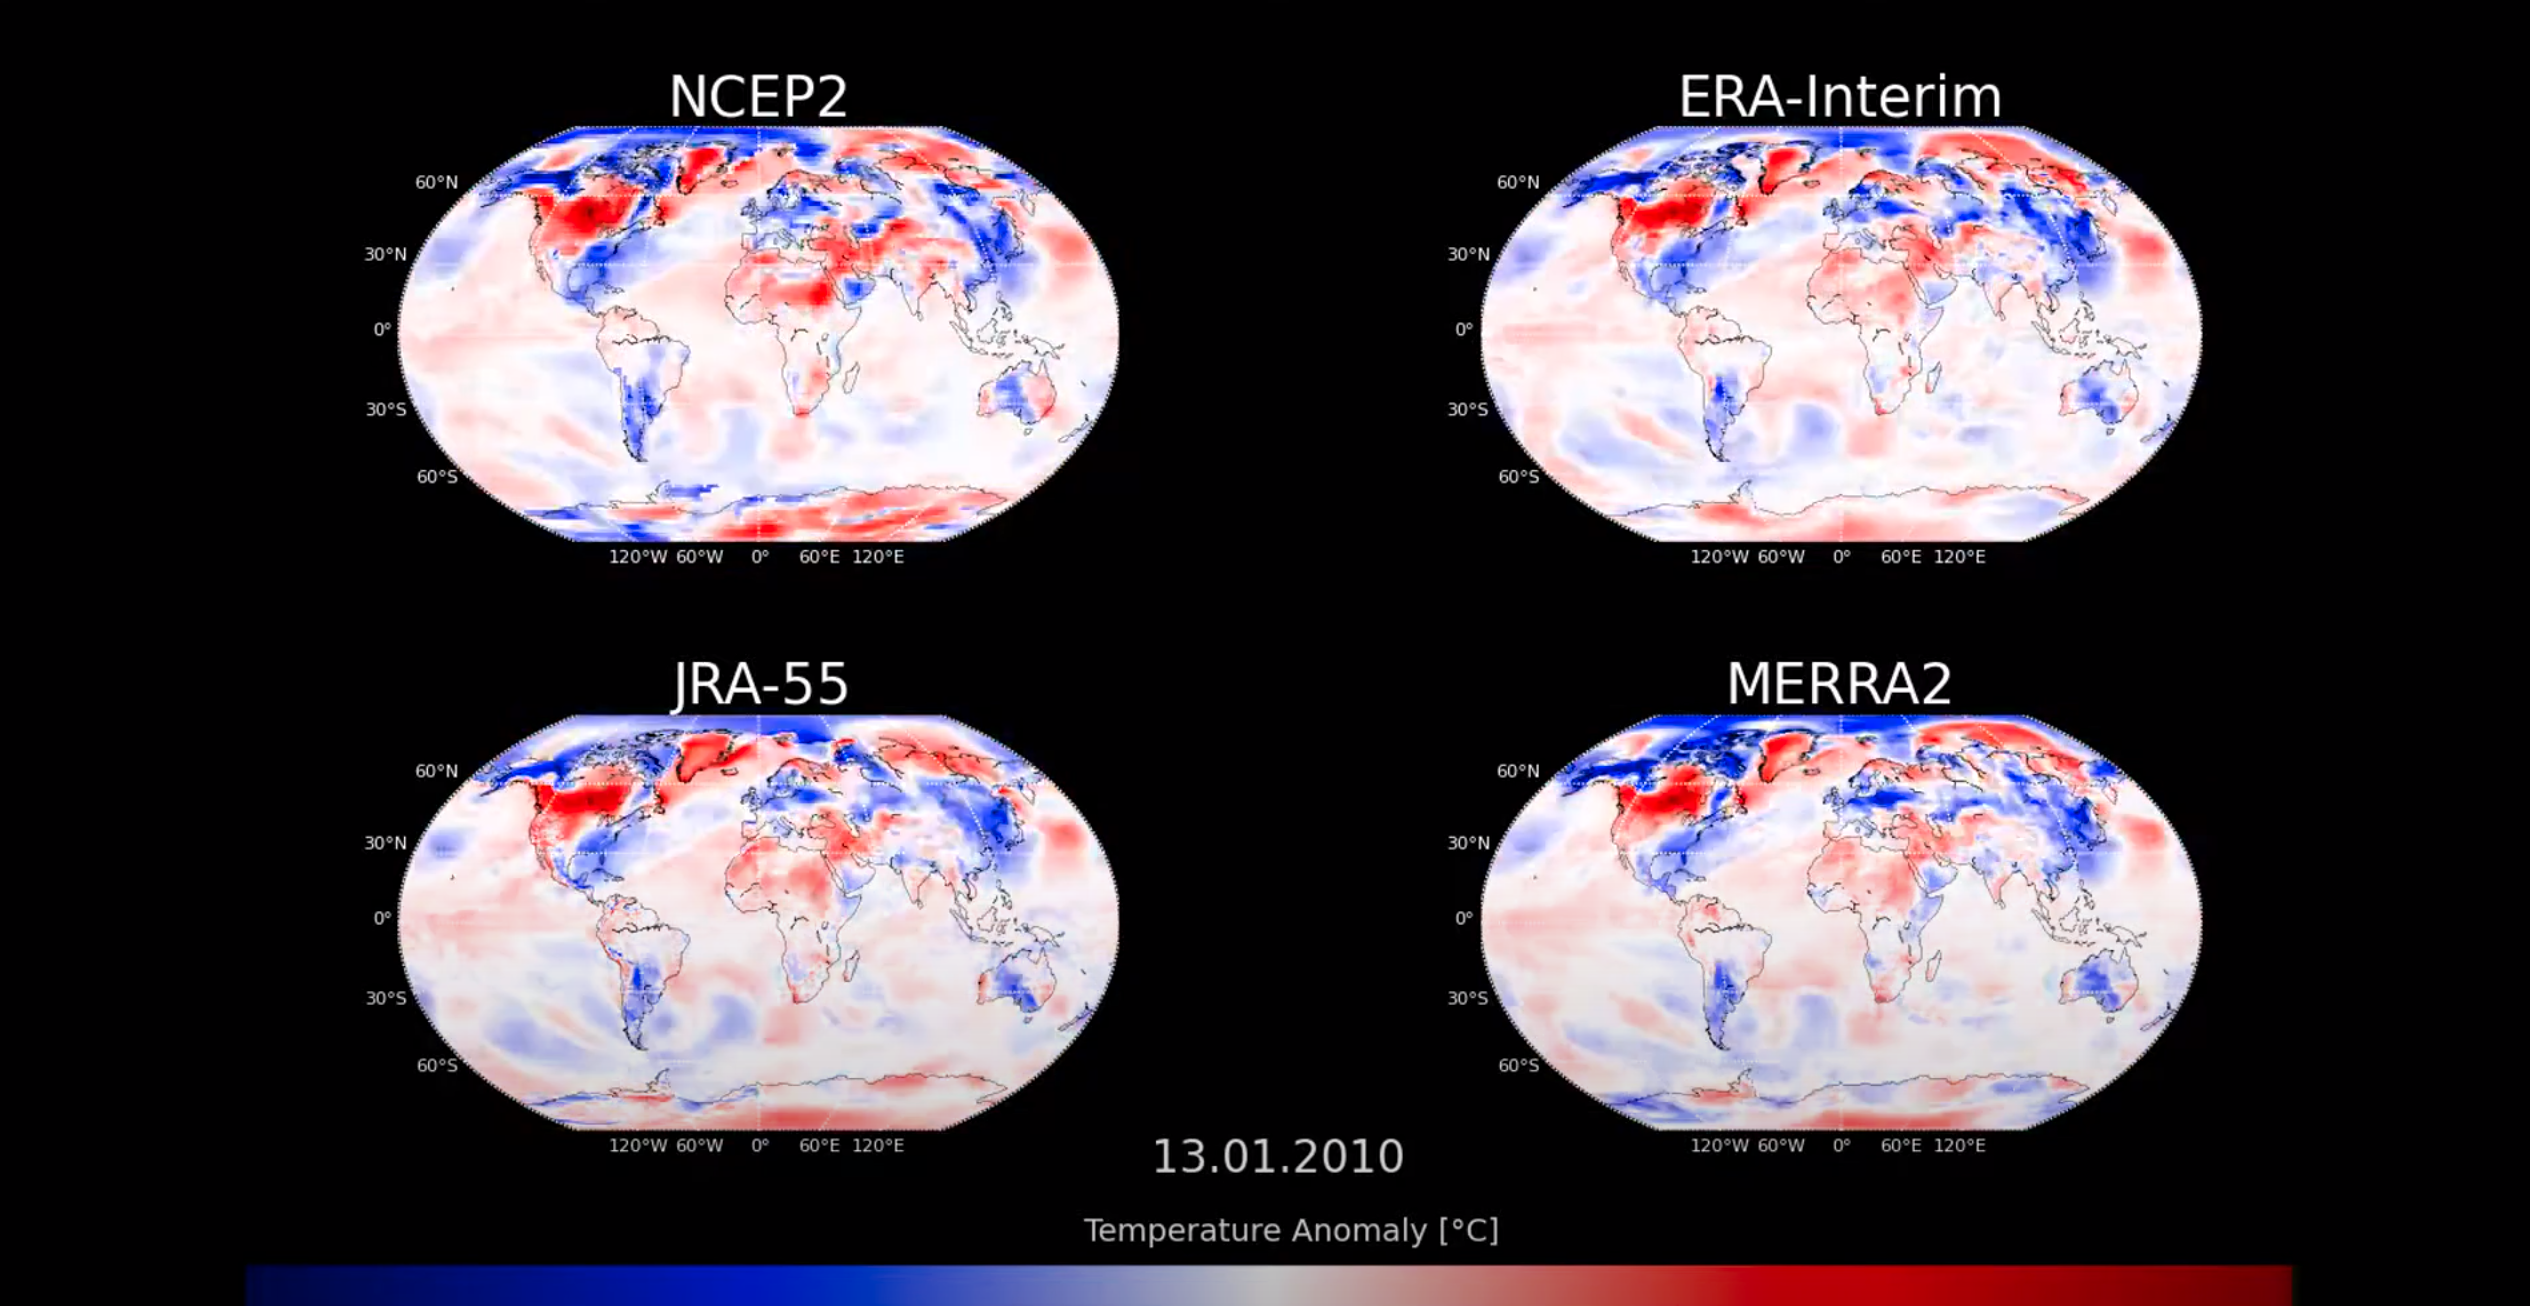
2010-2014 seasonal temperature anomalies. At every time step, the temperature anomaly shown is relative to the normal temperature at a given grid-cell, for that particular time of year. More specifically, the anomaly is relative to the climatology for the month-long period 15 days ahead and 15 days behind the current time step. Ideally, view as full screen on youtube and in high definition.

Oliver Angelil
Welcome to my site! I hope you find something interesting here.